C# Logging using Trace and DebugView
0 CommentsWelcome to the first blog post of 2015. In this post I want to show you how the Trace class from .NET can help you debug an application (in production) as well as creating logs for you.
We start by creating a simple WPF project or if you prefer WinForms you can use that too. Add a simple button on it with a click event and add the following code to the click event handler.
Trace.WriteLine("Button clicked");The Trace class is in the System.Diagnostics namespace, additional documentation can be found on MSDN.
When we start the Application from Visual Studio (with debugging) the output is written to the Output window or if you changed your VS configuration it might be written to the Immediate window instead.
When we start the project without debugging (ctrl + f5) and also open a program called DebugView (which you can download here). You can capture the trace output with that program.
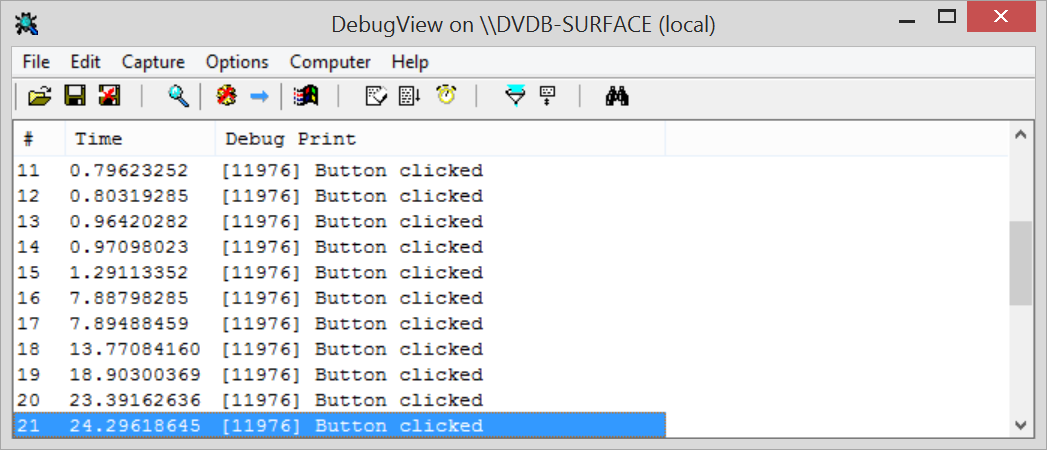
After clicking the button a few times you should have the following output:
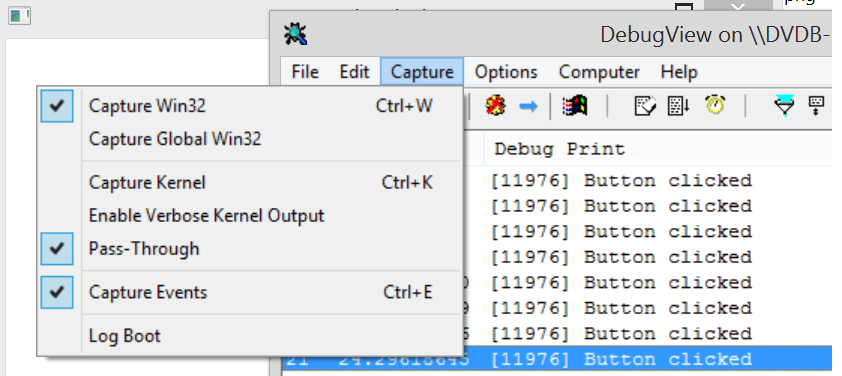
If it doesn’t work for you, check if the settings are like the screenshot below and make sure you aren’t running it in debug mode from Visual Studio.
I really like this way because I can leave my Trace code in the final code and when something goes wrong I can use DebugView to trace issues in a production environment. Another nice thing with the Trace stuff in .NET is that you can redirect it to a file or the event viewer simply by adding some configuration to the xml in the app.config.
<?xml version="1.0" encoding="utf-8" ?>
<configuration>
  <system.diagnostics>
    <trace autoflush="true">
      <listeners>
        <add name="log" type="System.Diagnostics.TextWriterTraceListener" initializeData="output.log" />
        <add name="event-tracer" type="System.Diagnostics.EventLogTraceListener" initializeData="WebAppEventViewername" />
        <!-- Remove comment to remove the DefaultTraceListener (makes it invisible for DebugView) -->
        <!--<remove name="Default" />-->
      </listeners>
    </trace>
  </system.diagnostics>
  <startup>
    <supportedRuntime version="v4.0" sku=".NETFramework,Version=v4.5" />
  </startup>
</configuration>
Now restart the application and click the button a few times. You will notice it created a new file called output.log with the log from the Trace.WriteLine call. Also open the windows event viewer and you will find some output there too. You should be able to find it under Windows Logs > Application with the “source” name from the initializeData.
If you get the following exception: "System.Security.SecurityException: The source was not found, but some or all event logs could not be searched. To create the source, you need permission to read all event logs to make sure that the new source name is unique. Inaccessible logs: Security." you can run the application as an administrator or add a new key to the registry. If you want to go for the registry appoach, open regedit and locate the following key: HKEY_LOCAL_MACHINE\SYSTEM\CurrentControlSet\Services\EventLog\Application\. After you found it, create a new key with with same name as specified in the web.config, in the above case it is WebAppEventViewername.
Open the new key and create an Expandable String Value with the name: “EventMessageFile” and the value should be C:\Windows\Microsoft.NET\Framework\v4.0.30319\EventLogMessages.dll.
If you really want something else (like logging to a database) you can also create your own tracelistener to make that work. The only thing required for this is to extend from TraceListener and you can add them to the configuration the same way as above.
I used the tracelisteners for logging to DebugView/file approach a few times lately and it helped me diagnose issues in our application, I hope you find it useful. Hope you liked this blogpost, feel free to comment and thanks for reading!